Fund holdings /
VANGUARD VALUE INDEX FUND (VTV) holdings
VANGUARD VALUE INDEX FUND held 326 positions on Jun 30, 2026, with net assets of $254.48B, as reported to the SEC on Form N-PORT (filed Aug 28, 2026). A fund's holdings report becomes public about 60 days after the date it covers, so this is not today's list.
Over time
Net assets from the fund's SEC reports, and its share price with Pro. The charts need JavaScript.
Largest holdings, charted
+ Add filterSort by Weight in the fund ▾High → low
PRO Chart all 295 companies in the fund, sorted and filtered by the screener's figures.
All 326 holdings
| # | Holding | Weight |
|---|
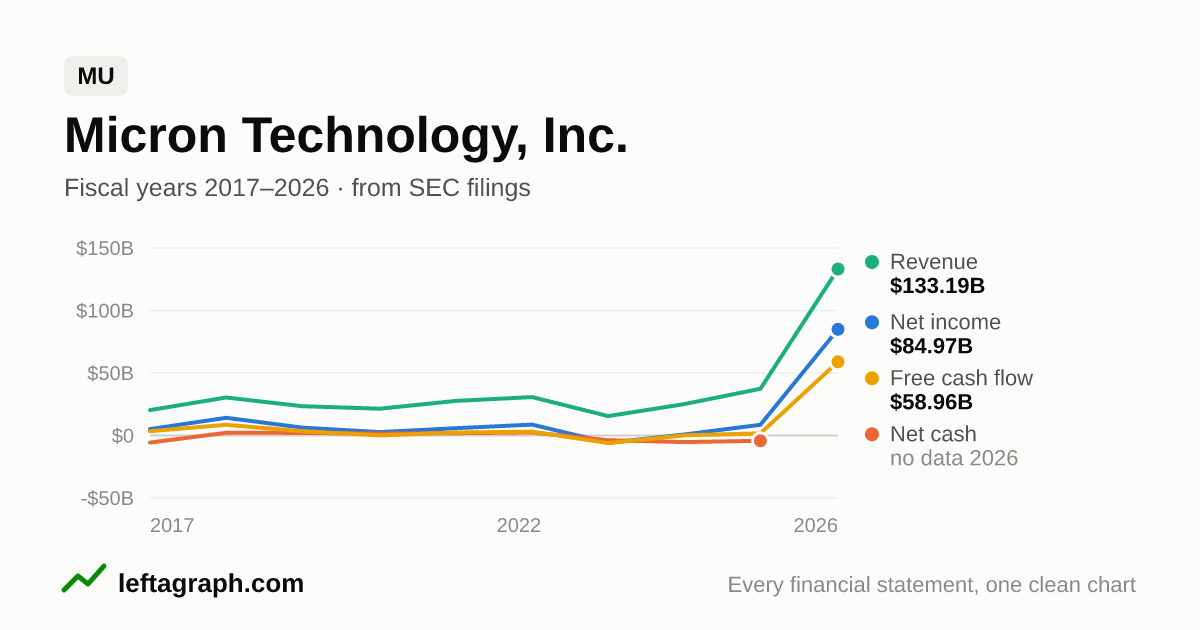
| 1 | MU Micron Technology Inc | 4.87% |
|---|
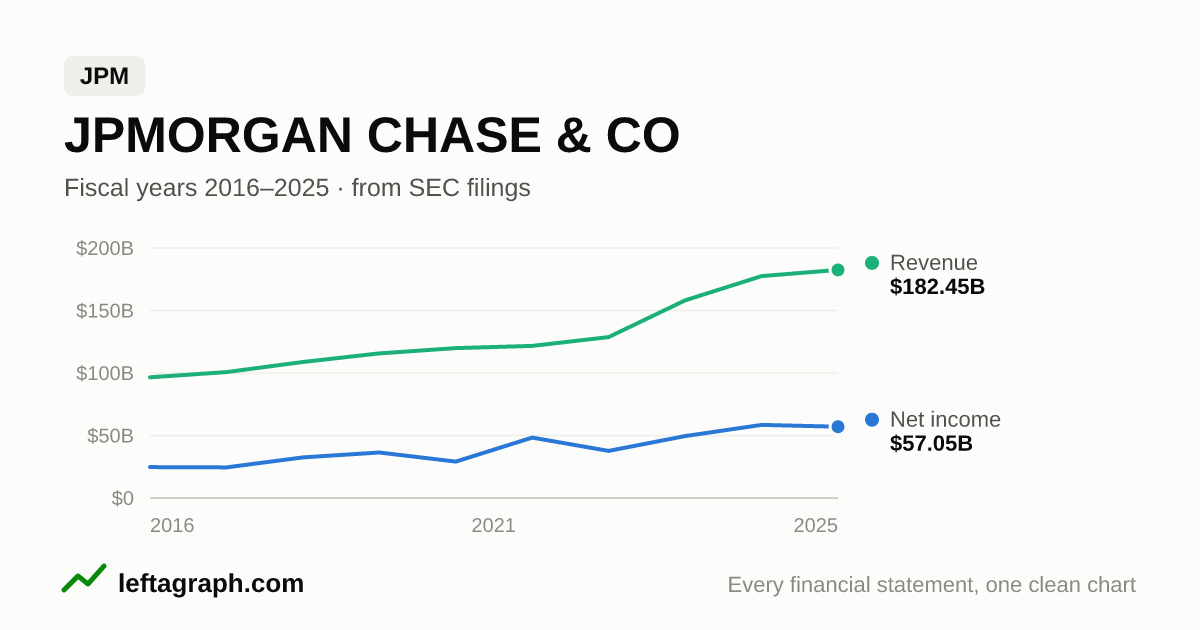
| 2 | JPM JPMorgan Chase & Co | 3.06% |
|---|
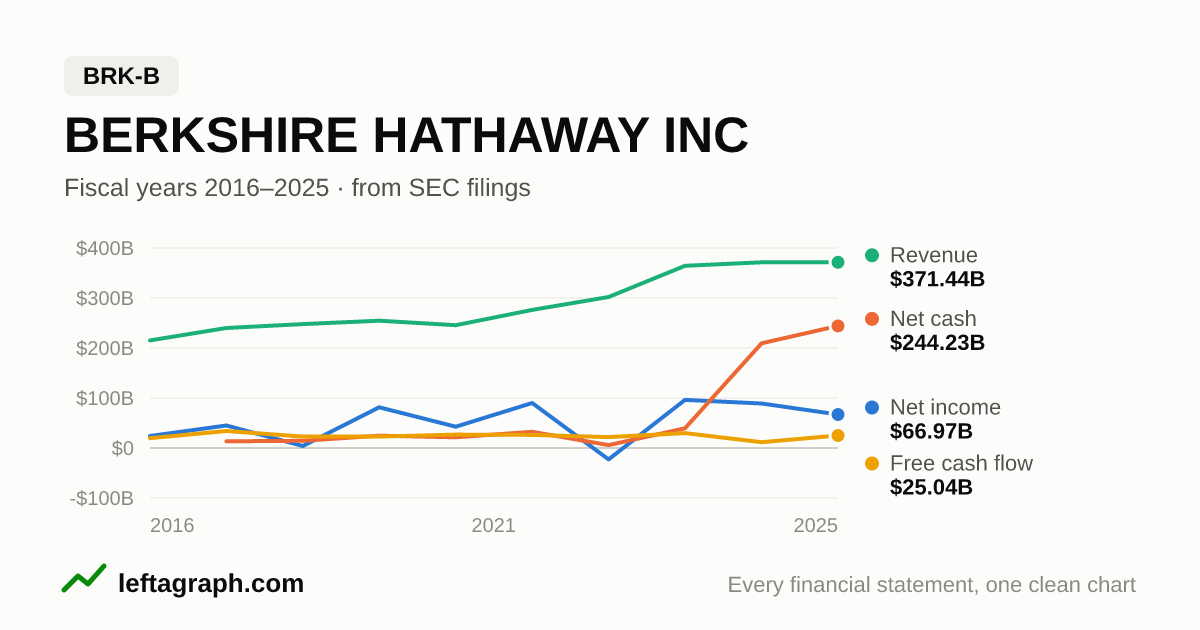
| 3 | BRK-B Berkshire Hathaway Inc | 2.95% |
|---|
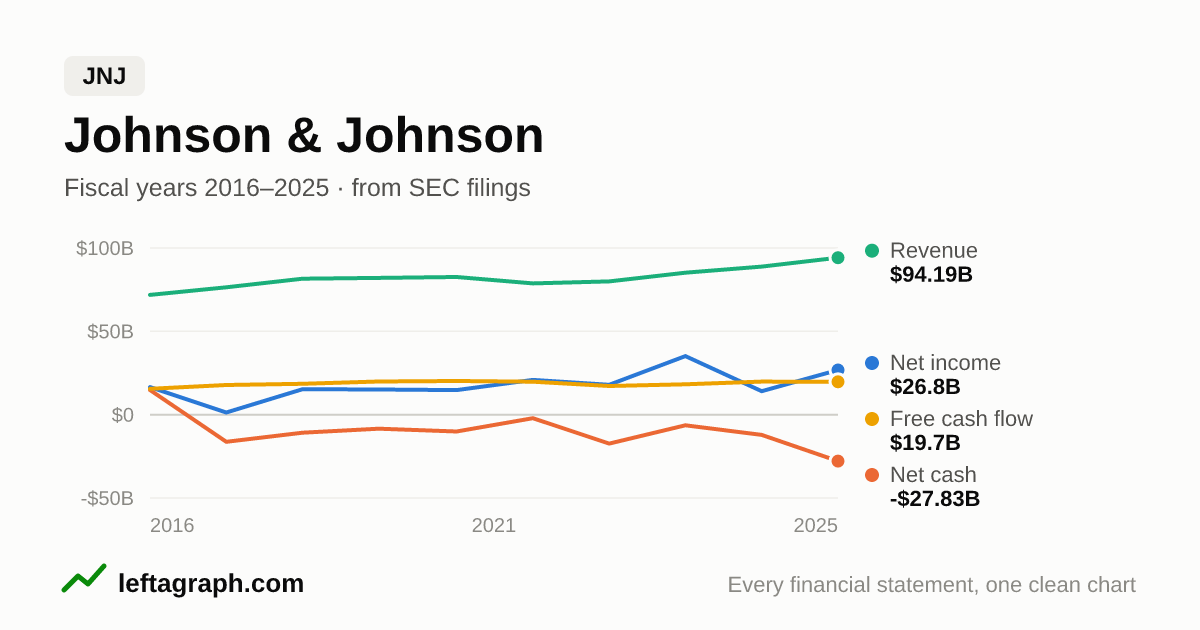
| 4 | JNJ Johnson & Johnson | 2.29% |
|---|
| 5 | — Exxon Mobil Corp | 2.12% |
|---|
| 6 | WMT Walmart Inc | 1.86% |
|---|
| 7 | CAT Caterpillar Inc | 1.83% |
|---|
| 8 | ABBV AbbVie Inc | 1.66% |
|---|
| 9 | CSCO Cisco Systems Inc | 1.56% |
|---|
| 10 | UNH UnitedHealth Group Inc | 1.41% |
|---|
| 11 | BAC Bank of America Corp | 1.36% |
|---|
| 12 | HD Home Depot Inc/The | 1.32% |
|---|
| 13 | PG Procter & Gamble Co/The | 1.28% |
|---|
| 14 | MRK Merck & Co Inc | 1.19% |
|---|
| 15 | CVX Chevron Corp | 1.17% |
|---|
| 16 | GS Goldman Sachs Group Inc/The | 1.06% |
|---|
| 17 | PM Philip Morris International Inc | 1.05% |
|---|
| 18 | INTC Intel Corp | 1.05% |
|---|
| 19 | KO Coca-Cola Co/The | 1.05% |
|---|
| 20 | IBM International Business Machines Corp | 0.99% |
|---|
| 21 | RTX RTX Corp | 0.96% |
|---|
| 22 | WFC Wells Fargo & Co | 0.95% |
|---|
| 23 | MS Morgan Stanley | 0.93% |
|---|
| 24 | LIN Linde PLC | 0.90% |
|---|
| 25 | C Citigroup Inc | 0.85% |
|---|
| 26 | — Vanguard Cmt Funds-Vanguard Market Liquidity Fund short-term investment (cash) | 0.76% |
|---|
| 27 | AMGN Amgen Inc | 0.73% |
|---|
| 28 | GE General Electric Co | 0.73% |
|---|
| 29 | QCOM QUALCOMM Inc | 0.73% |
|---|
| 30 | ADI Analog Devices Inc | 0.72% |
|---|
| 31 | TMO Thermo Fisher Scientific Inc | 0.70% |
|---|
| 32 | PEP PepsiCo Inc | 0.69% |
|---|
| 33 | AXP American Express Co | 0.69% |
|---|
| 34 | NEE NextEra Energy Inc | 0.65% |
|---|
| 35 | DIS Walt Disney Co/The | 0.63% |
|---|
| 36 | ETN Eaton Corp PLC | 0.62% |
|---|
| 37 | DE Deere & Co | 0.61% |
|---|
| 38 | UNP Union Pacific Corp | 0.60% |
|---|
| 39 | VZ Verizon Communications Inc | 0.59% |
|---|
| 40 | ABT Abbott Laboratories | 0.59% |
|---|
| 41 | GILD Gilead Sciences Inc | 0.59% |
|---|
| 42 | SCHW Charles Schwab Corp/The | 0.57% |
|---|
| 43 | T AT&T Inc | 0.54% |
|---|
| 44 | BRK-B Berkshire Hathaway Inc | 0.52% |
|---|
| 45 | PFE Pfizer Inc | 0.51% |
|---|
| 46 | TXN Texas Instruments Inc | 0.51% |
|---|
| 47 | — BlackRock Funding Inc/DE | 0.50% |
|---|
| 48 | CVS CVS Health Corp | 0.49% |
|---|
| 49 | PGR Progressive Corp/The | 0.48% |
|---|
| 50 | COP ConocoPhillips | 0.47% |
|---|
| 51 | PLD Prologis Inc | 0.47% |
|---|
| 52 | DELL Dell Technologies Inc | 0.47% |
|---|
| 53 | COF Capital One Financial Corp | 0.47% |
|---|
| 54 | LOW Lowe's Cos Inc | 0.46% |
|---|
| 55 | PH Parker-Hannifin Corp | 0.46% |
|---|
| 56 | CRM Salesforce Inc | 0.46% |
|---|
| 57 | DHR Danaher Corp | 0.45% |
|---|
| 58 | MO Altria Group Inc | 0.45% |
|---|
| 59 | CB Chubb Ltd | 0.44% |
|---|
| 60 | BMY Bristol-Myers Squibb Co | 0.44% |
|---|
| 61 | LMT Lockheed Martin Corp | 0.44% |
|---|
| 62 | SPGI S&P Global Inc | 0.44% |
|---|
| 63 | TT Trane Technologies PLC | 0.41% |
|---|
| 64 | SO Southern Co/The | 0.40% |
|---|
| 65 | MDT Medtronic PLC | 0.38% |
|---|
| 66 | NEM Newmont Corp | 0.37% |
|---|
| 67 | BNY Bank of New York Mellon Corp/The | 0.37% |
|---|
| 68 | PNC PNC Financial Services Group Inc/The | 0.37% |
|---|
| 69 | GLW Corning Inc | 0.37% |
|---|
| 70 | DUK Duke Energy Corp | 0.37% |
|---|
| 71 | CMI Cummins Inc | 0.37% |
|---|
| 72 | USB US Bancorp | 0.35% |
|---|
| 73 | GD General Dynamics Corp | 0.34% |
|---|
| 74 | WMB Williams Cos Inc/The | 0.34% |
|---|
| 75 | MCK McKesson Corp | 0.34% |
|---|
| 76 | FCX Freeport-McMoRan Inc | 0.34% |
|---|
| 77 | ADP Automatic Data Processing Inc | 0.33% |
|---|
| 78 | WM Waste Management Inc | 0.33% |
|---|
| 79 | JCI Johnson Controls International plc | 0.33% |
|---|
| 80 | CSX CSX Corp | 0.33% |
|---|
| 81 | CMCSA Comcast Corp | 0.33% |
|---|
| 82 | MMM 3M Co | 0.32% |
|---|
| 83 | ELV Elevance Health Inc | 0.31% |
|---|
| 84 | CEG Constellation Energy Corp | 0.30% |
|---|
| 85 | MRSH Marsh & McLennan Cos Inc | 0.30% |
|---|
| 86 | UPS United Parcel Service Inc | 0.30% |
|---|
| 87 | EMR Emerson Electric Co | 0.30% |
|---|
| 88 | CME CME Group Inc | 0.30% |
|---|
| 89 | VLO Valero Energy Corp | 0.29% |
|---|
| 90 | ACN Accenture PLC | 0.29% |
|---|
| 91 | AMT American Tower Corp | 0.29% |
|---|
| 92 | MPC Marathon Petroleum Corp | 0.28% |
|---|
| 93 | AEP American Electric Power Co Inc | 0.28% |
|---|
| 94 | MDLZ Mondelez International Inc | 0.28% |
|---|
| 95 | ITW Illinois Tool Works Inc | 0.28% |
|---|
| 96 | UBER Uber Technologies Inc | 0.27% |
|---|
| 97 | CL Colgate-Palmolive Co | 0.27% |
|---|
| 98 | CI Cigna Group/The | 0.27% |
|---|
| 99 | TMUS T-Mobile US Inc | 0.27% |
|---|
| 100 | NOC Northrop Grumman Corp | 0.27% |
|---|
| 101 | CRH CRH PLC | 0.27% |
|---|
| 102 | HON Honeywell International Inc | 0.27% |
|---|
| 103 | URI United Rentals Inc | 0.27% |
|---|
| 104 | NSC Norfolk Southern Corp | 0.26% |
|---|
| 105 | TRV Travelers Cos Inc/The | 0.26% |
|---|
| 106 | — Honeywell Aerospace Inc | 0.26% |
|---|
| 107 | ICE Intercontinental Exchange Inc | 0.26% |
|---|
| 108 | GM General Motors Co | 0.26% |
|---|
| 109 | SLB SLB Ltd | 0.26% |
|---|
| 110 | EOG EOG Resources Inc | 0.26% |
|---|
| 111 | SPG Simon Property Group Inc | 0.26% |
|---|
| 112 | ROST Ross Stores Inc | 0.26% |
|---|
| 113 | PSX Phillips 66 | 0.25% |
|---|
| 114 | AON Aon PLC | 0.25% |
|---|
| 115 | FDX FedEx Corp | 0.25% |
|---|
| 116 | APD Air Products and Chemicals Inc | 0.24% |
|---|
| 117 | REGN Regeneron Pharmaceuticals Inc | 0.24% |
|---|
| 118 | — Warner Bros Discovery Inc | 0.24% |
|---|
| 119 | PCAR PACCAR Inc | 0.24% |
|---|
| 120 | DLR Digital Realty Trust Inc | 0.24% |
|---|
| 121 | TFC Truist Financial Corp | 0.23% |
|---|
| 122 | KKR KKR & Co Inc | 0.23% |
|---|
| 123 | ALL Allstate Corp/The | 0.23% |
|---|
| 124 | SRE Sempra | 0.23% |
|---|
| 125 | HCA HCA Healthcare Inc | 0.23% |
|---|
| 126 | KMI Kinder Morgan Inc | 0.23% |
|---|
| 127 | D Dominion Energy Inc | 0.22% |
|---|
| 128 | KEYS Keysight Technologies Inc | 0.22% |
|---|
| 129 | HPE Hewlett Packard Enterprise Co | 0.22% |
|---|
| 130 | TGT Target Corp | 0.22% |
|---|
| 131 | AJG Arthur J Gallagher & Co | 0.22% |
|---|
| 132 | TEL TE Connectivity PLC | 0.22% |
|---|
| 133 | DAL Delta Air Lines Inc | 0.22% |
|---|
| 134 | CARR Carrier Global Corp | 0.22% |
|---|
| 135 | CTVA Corteva Inc | 0.21% |
|---|
| 136 | CAH Cardinal Health Inc | 0.21% |
|---|
| 137 | AME AMETEK Inc | 0.21% |
|---|
| 138 | ROK Rockwell Automation Inc | 0.21% |
|---|
| 139 | BKR Baker Hughes Co | 0.21% |
|---|
| 140 | ETR Entergy Corp | 0.21% |
|---|
| 141 | OKE ONEOK Inc | 0.20% |
|---|
| 142 | F Ford Motor Co | 0.20% |
|---|
| 143 | SYK Stryker Corp | 0.20% |
|---|
| 144 | LHX L3Harris Technologies Inc | 0.20% |
|---|
| 145 | AFL Aflac Inc | 0.20% |
|---|
| 146 | VST Vistra Corp | 0.20% |
|---|
| 147 | COR Cencora Inc | 0.20% |
|---|
| 148 | EW Edwards Lifesciences Corp | 0.19% |
|---|
| 149 | — Electronic Arts Inc | 0.19% |
|---|
| 150 | FITB Fifth Third Bancorp | 0.19% |
|---|
| 151 | NUE Nucor Corp | 0.19% |
|---|
| 152 | PSA Public Storage | 0.19% |
|---|
| 153 | LNG Cheniere Energy Inc | 0.19% |
|---|
| 154 | XEL Xcel Energy Inc | 0.19% |
|---|
| 155 | EBAY eBay Inc | 0.19% |
|---|
| 156 | MCHP Microchip Technology Inc | 0.19% |
|---|
| 157 | NKE NIKE Inc | 0.18% |
|---|
| 158 | EXC Exelon Corp | 0.18% |
|---|
| 159 | HUM Humana Inc | 0.18% |
|---|
| 160 | DVN Devon Energy Corp | 0.18% |
|---|
| 161 | MET MetLife Inc | 0.17% |
|---|
| 162 | FERG Ferguson Enterprises Inc | 0.17% |
|---|
| 163 | WAB Westinghouse Air Brake Technologies Corp | 0.17% |
|---|
| 164 | STT State Street Corp | 0.17% |
|---|
| 165 | UAL United Airlines Holdings Inc | 0.17% |
|---|
| 166 | BX Blackstone Inc | 0.16% |
|---|
| 167 | VTR Ventas Inc | 0.16% |
|---|
| 168 | RSG Republic Services Inc | 0.16% |
|---|
| 169 | KDP Keurig Dr Pepper Inc | 0.16% |
|---|
| 170 | — DR Horton Inc | 0.16% |
|---|
| 171 | BDX Becton Dickinson & Co | 0.16% |
|---|
| 172 | AMP Ameriprise Financial Inc | 0.16% |
|---|
| 173 | ADBE Adobe Inc | 0.16% |
|---|
| 174 | ED Consolidated Edison Inc | 0.15% |
|---|
| 175 | PEG Public Service Enterprise Group Inc | 0.15% |
|---|
| 176 | SHW Sherwin-Williams Co/The | 0.15% |
|---|
| 177 | NDAQ Nasdaq Inc | 0.15% |
|---|
| 178 | SYY Sysco Corp | 0.15% |
|---|
| 179 | AIG American International Group Inc | 0.15% |
|---|
| 180 | CBRE CBRE Group Inc | 0.15% |
|---|
| 181 | GRMN Garmin Ltd | 0.15% |
|---|
| 182 | RCL Royal Caribbean Cruises Ltd | 0.14% |
|---|
| 183 | WEC WEC Energy Group Inc | 0.14% |
|---|
| 184 | A Agilent Technologies Inc | 0.14% |
|---|
| 185 | PRU Prudential Financial Inc | 0.14% |
|---|
| 186 | ON ON Semiconductor Corp | 0.14% |
|---|
| 187 | ADM Archer-Daniels-Midland Co | 0.14% |
|---|
| 188 | KVUE Kenvue Inc | 0.14% |
|---|
| 189 | KMB Kimberly-Clark Corp | 0.14% |
|---|
| 190 | — Hartford Financial Services Group Inc/The | 0.14% |
|---|
| 191 | OXY Occidental Petroleum Corp | 0.14% |
|---|
| 192 | PCG PG&E Corp | 0.13% |
|---|
| 193 | HBAN Huntington Bancshares Inc/OH | 0.13% |
|---|
| 194 | INTU Intuit Inc | 0.13% |
|---|
| 195 | IRM Iron Mountain Inc | 0.13% |
|---|
| 196 | CCL Carnival Corp Ltd | 0.13% |
|---|
| 197 | MTB M&T Bank Corp | 0.13% |
|---|
| 198 | FANG Diamondback Energy Inc | 0.13% |
|---|
| 199 | ROP Roper Technologies Inc | 0.13% |
|---|
| 200 | CCI Crown Castle Inc | 0.12% |
|---|
| 201 | IQV IQVIA Holdings Inc | 0.12% |
|---|
| 202 | ACGL Arch Capital Group Ltd | 0.12% |
|---|
| 203 | IR Ingersoll Rand Inc | 0.12% |
|---|
| 204 | BIIB Biogen Inc | 0.12% |
|---|
| 205 | BSX Boston Scientific Corp | 0.12% |
|---|
| 206 | PAYX Paychex Inc | 0.12% |
|---|
| 207 | AEE Ameren Corp | 0.12% |
|---|
| 208 | TDY Teledyne Technologies Inc | 0.12% |
|---|
| 209 | EXR Extra Space Storage Inc | 0.11% |
|---|
| 210 | NTRS Northern Trust Corp | 0.11% |
|---|
| 211 | NTAP NetApp Inc | 0.11% |
|---|
| 212 | DOV Dover Corp | 0.11% |
|---|
| 213 | GEHC GE HealthCare Technologies Inc | 0.11% |
|---|
| 214 | O Realty Income Corp | 0.11% |
|---|
| 215 | CINF Cincinnati Financial Corp | 0.11% |
|---|
| 216 | CNP CenterPoint Energy Inc | 0.11% |
|---|
| 217 | MSTR Strategy Inc | 0.11% |
|---|
| 218 | EIX Edison International | 0.11% |
|---|
| 219 | CFG Citizens Financial Group Inc | 0.11% |
|---|
| 220 | XYL Xylem Inc/NY | 0.10% |
|---|
| 221 | OTIS Otis Worldwide Corp | 0.10% |
|---|
| 222 | ZTS Zoetis Inc | 0.10% |
|---|
| 223 | ES Eversource Energy | 0.10% |
|---|
| 224 | PPG PPG Industries Inc | 0.10% |
|---|
| 225 | DTE DTE Energy Co | 0.10% |
|---|
| 226 | VICI VICI Properties Inc | 0.10% |
|---|
| 227 | — AvalonBay Communities Inc | 0.10% |
|---|
| 228 | PHM PulteGroup Inc | 0.10% |
|---|
| 229 | FE FirstEnergy Corp | 0.10% |
|---|
| 230 | HSY Hershey Co/The | 0.10% |
|---|
| 231 | PPL PPL Corp | 0.10% |
|---|
| 232 | RF Regions Financial Corp | 0.10% |
|---|
| 233 | AWK American Water Works Co Inc | 0.10% |
|---|
| 234 | SYF Synchrony Financial | 0.10% |
|---|
| 235 | RJF Raymond James Financial Inc | 0.10% |
|---|
| 236 | HAL Halliburton Co | 0.10% |
|---|
| 237 | — Equity Residential | 0.10% |
|---|
| 238 | CBOE Cboe Global Markets Inc | 0.09% |
|---|
| 239 | DG Dollar General Corp | 0.09% |
|---|
| 240 | LUV Southwest Airlines Co | 0.09% |
|---|
| 241 | KEY KeyCorp | 0.09% |
|---|
| 242 | KR Kroger Co/The | 0.09% |
|---|
| 243 | WTW Willis Towers Watson PLC | 0.09% |
|---|
| 244 | CPRT Copart Inc | 0.09% |
|---|
| 245 | TROW T Rowe Price Group Inc | 0.09% |
|---|
| 246 | APO Apollo Global Management Inc | 0.09% |
|---|
| 247 | CMS CMS Energy Corp | 0.09% |
|---|
| 248 | DRI Darden Restaurants Inc | 0.09% |
|---|
| 249 | FISV Fiserv Inc | 0.09% |
|---|
| 250 | DGX Quest Diagnostics Inc | 0.09% |
|---|
| 251 | PFG Principal Financial Group Inc | 0.09% |
|---|
| 252 | MKL Markel Group Inc | 0.09% |
|---|
| 253 | LH Labcorp Holdings Inc | 0.09% |
|---|
| 254 | PYPL PayPal Holdings Inc | 0.09% |
|---|
| 255 | CHD Church & Dwight Co Inc | 0.09% |
|---|
| 256 | DLTR Dollar Tree Inc | 0.08% |
|---|
| 257 | VLTO Veralto Corp | 0.08% |
|---|
| 258 | — Zoom Video Communications Inc | 0.08% |
|---|
| 259 | EXPD Expeditors International of Washington Inc | 0.08% |
|---|
| 260 | PKG Packaging Corp of America | 0.08% |
|---|
| 261 | SNA Snap-on Inc | 0.08% |
|---|
| 262 | CPAY Corpay Inc | 0.08% |
|---|
| 263 | STE STERIS PLC | 0.08% |
|---|
| 264 | STZ Constellation Brands Inc | 0.08% |
|---|
| 265 | FIS Fidelity National Information Services Inc | 0.08% |
|---|
| 266 | HPQ HP Inc | 0.07% |
|---|
| 267 | WRB W R Berkley Corp | 0.07% |
|---|
| 268 | ULTA Ulta Beauty Inc | 0.07% |
|---|
| 269 | KHC Kraft Heinz Co/The | 0.07% |
|---|
| 270 | EL Estee Lauder Cos Inc/The | 0.07% |
|---|
| 271 | LEN Lennar Corp | 0.07% |
|---|
| 272 | EFX Equifax Inc | 0.07% |
|---|
| 273 | L Loews Corp | 0.07% |
|---|
| 274 | BRO Brown & Brown Inc | 0.07% |
|---|
| 275 | IBKR Interactive Brokers Group Inc | 0.07% |
|---|
| 276 | WAT Waters Corp | 0.07% |
|---|
| 277 | CTSH Cognizant Technology Solutions Corp | 0.07% |
|---|
| 278 | MLM Martin Marietta Materials Inc | 0.06% |
|---|
| 279 | Q Qnity Electronics Inc | 0.06% |
|---|
| 280 | TSN Tyson Foods Inc | 0.06% |
|---|
| 281 | CNC Centene Corp | 0.06% |
|---|
| 282 | STLD Steel Dynamics Inc | 0.06% |
|---|
| 283 | SUNB Sunbelt Rentals Holdings Inc | 0.06% |
|---|
| 284 | GPN Global Payments Inc | 0.06% |
|---|
| 285 | MDLN Medline Inc | 0.06% |
|---|
| 286 | RKT Rocket Cos Inc | 0.05% |
|---|
| 287 | EXPE Expedia Group Inc | 0.05% |
|---|
| 288 | HUBB Hubbell Inc | 0.05% |
|---|
| 289 | NI NiSource Inc | 0.04% |
|---|
| 290 | IP International Paper Co | 0.04% |
|---|
| 291 | LNT Alliant Energy Corp | 0.04% |
|---|
| 292 | DOW Dow Inc | 0.04% |
|---|
| 293 | IFF International Flavors & Fragrances Inc | 0.04% |
|---|
| 294 | FOXA Fox Corp | 0.04% |
|---|
| 295 | FTV Fortive Corp | 0.03% |
|---|
| 296 | GIS General Mills Inc | 0.03% |
|---|
| 297 | NVR NVR Inc | 0.03% |
|---|
| 298 | ZBH Zimmer Biomet Holdings Inc | 0.03% |
|---|
| 299 | EQT EQT Corp | 0.03% |
|---|
| 300 | TSCO Tractor Supply Co | 0.03% |
|---|
| 301 | BR Broadridge Financial Solutions Inc | 0.03% |
|---|
| 302 | FLUT Flutter Entertainment PLC | 0.03% |
|---|
| 303 | LYB LyondellBasell Industries NV | 0.03% |
|---|
| 304 | MKC McCormick & Co Inc/MD | 0.02% |
|---|
| 305 | SSNC SS&C Technologies Holdings Inc | 0.02% |
|---|
| 306 | CHTR Charter Communications Inc | 0.02% |
|---|
| 307 | FOXA Fox Corp | 0.02% |
|---|
| 308 | — Vanguard Cmt Funds-Vanguard Market Liquidity Fund short-term investment (cash) | 0.01% |
|---|
| 309 | LULU Lululemon Athletica Inc | 0.01% |
|---|
| 310 | — TRS:PAYPAL HOLDINGS INC USD 2026-Aug-31 derivative (futures, swaps) | <0.01% |
|---|
| 311 | — TRS:GLOBAL PAYMENTS INC USD 2026-Aug-31 derivative (futures, swaps) | <0.01% |
|---|
| 312 | — TRS:NEXTERA ENERGY INC USD 2027-Jan-29 derivative (futures, swaps) | <0.01% |
|---|
| 313 | LEN Lennar Corp | <0.01% |
|---|
| 314 | — S&P500 EMINI FUT Sep26 derivative (futures, swaps) | <0.01% |
|---|
| 315 | — TRS:GLOBAL PAYMENTS INC USD 2027-Jan-29 derivative (futures, swaps) | 0.00% |
|---|
| 316 | — TRS:PAYPAL HOLDINGS INC USD 2027-Jan-29 derivative (futures, swaps) | 0.00% |
|---|
| 317 | — TRS:VICI PROPERTIES INC USD 2026-Aug-31 derivative (futures, swaps) | 0.00% |
|---|
| 318 | — TRS:VICI PROPERTIES INC USD 2027-Jan-29 derivative (futures, swaps) | 0.00% |
|---|
| 319 | — TRS:RAYMOND JAMES FINANCIAL INC USD 2027-Jan-29 derivative (futures, swaps) | <0.01% |
|---|
| 320 | — TRS:CITIGROUP INC USD 2027-Jan-29 derivative (futures, swaps) | <0.01% |
|---|
| 321 | — TRS:ELEVANCE HEALTH INC USD 2027-Jan-29 derivative (futures, swaps) | <0.01% |
|---|
| 322 | — TRS:JPMORGAN CHASE & CO USD 2027-Jan-29 derivative (futures, swaps) | <0.01% |
|---|
| 323 | — TRS:CITIGROUP INC USD 2027-Aug-31 derivative (futures, swaps) | <0.01% |
|---|
| 324 | — TRS:GOLDMAN SACHS GROUP INC USD 2027-Aug-31 derivative (futures, swaps) | <0.01% |
|---|
| 325 | — TRS:KROGER CO USD 2027-Jan-29 derivative (futures, swaps) | <0.01% |
|---|
| 326 | — TRS:JPMORGAN CHASE & CO USD 2027-Aug-31 derivative (futures, swaps) | <0.01% |
|---|
Weight: the holding's value as a share of the fund's net assets, as filed. Futures and cash can make the weights add up to a little more or less than 100%. 298 of 326 holdings link to the company's charts; a holding is linked only when its name matches exactly one company in the SEC's list (— = no link). How this list is read.
Other funds
VOO · IVV · VTI · QQQ · SCHD · VUG · VO · SPYM · VGT · VB · VIG · XLK · IJH · IWF · QQQM · IJR · RSP · ITOT · VYM · VXF · DFAC · IWD · IWM · IVW · VV · SCHX · SMH · VNQ · VBR · SCHG · IWR · VONG · SPYG · XLF · IVE · IWB · QUAL · XLV · SOXX · JEPI · DGRO · XLE · SCHB · JEPQ · VBK · DYNF · CGDV · SPYV
Not investment advice. This page shows what the fund reported to the SEC. Nothing here is a recommendation about any security. Check important figures against the fund's own filing.