Fund holdings /
JPMorgan Nasdaq Equity Premium Income ETF (JEPQ) holdings
JPMorgan Nasdaq Equity Premium Income ETF held 111 positions on Jun 30, 2026, with net assets of $40.66B, as reported to the SEC on Form N-PORT (filed Aug 28, 2026). A fund's holdings report becomes public about 60 days after the date it covers, so this is not today's list.
Over time
Net assets from the fund's SEC reports, and its share price with Pro. The charts need JavaScript.
Largest holdings, charted
+ Add filterSort by Weight in the fund ▾High → low
PRO Chart all 91 companies in the fund, sorted and filtered by the screener's figures.
All 111 holdings
| # | Holding | Weight |
|---|
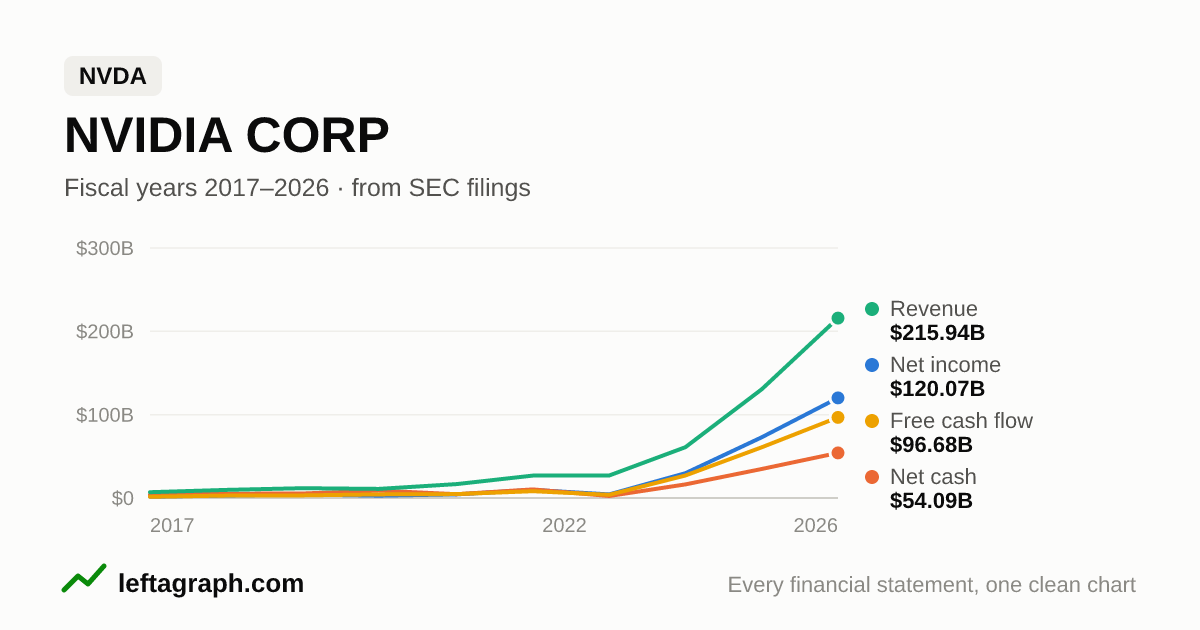
| 1 | NVDA NVIDIA Corp. | 6.59% |
|---|
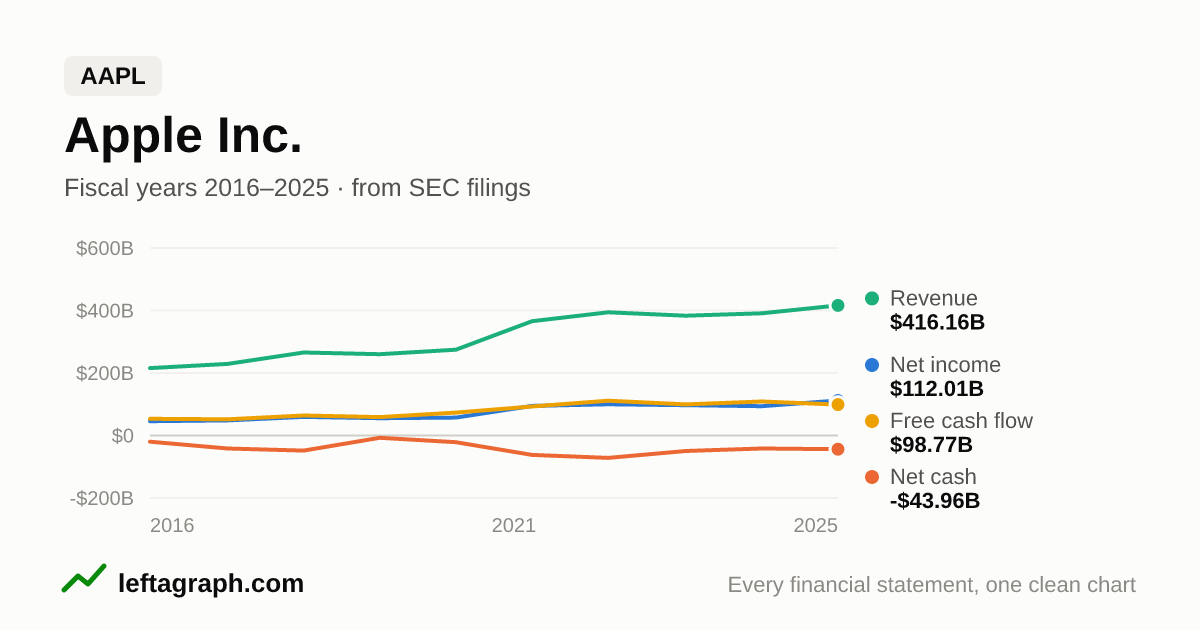
| 2 | AAPL Apple, Inc. | 5.74% |
|---|
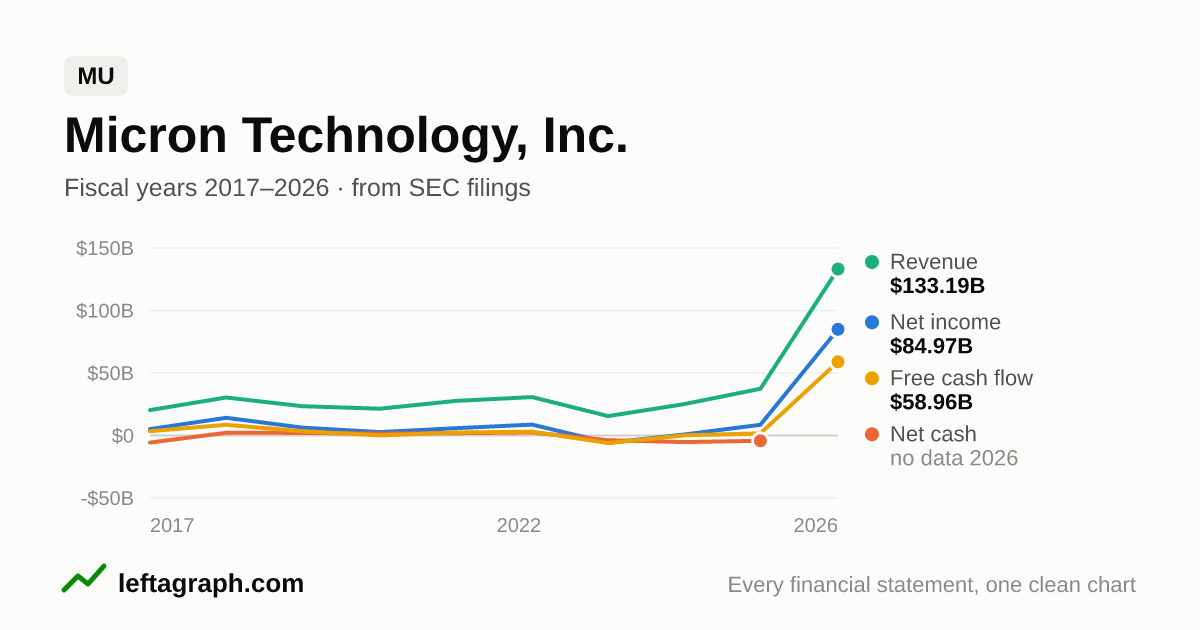
| 3 | MU Micron Technology, Inc. | 5.50% |
|---|
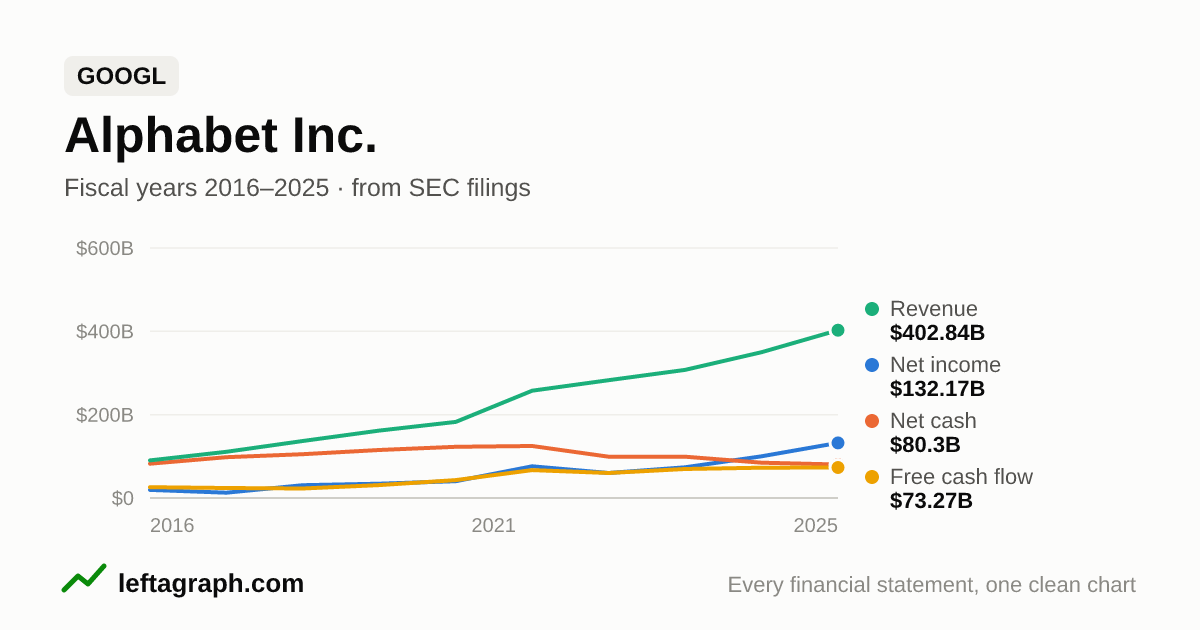
| 4 | GOOGL Alphabet, Inc. | 4.98% |
|---|
| 5 | MSFT Microsoft Corp. | 3.84% |
|---|
| 6 | AMD Advanced Micro Devices, Inc. | 3.81% |
|---|
| 7 | AMZN Amazon.com, Inc. | 3.62% |
|---|
| 8 | LRCX Lam Research Corp. | 2.85% |
|---|
| 9 | TSLA Tesla, Inc. | 2.36% |
|---|
| 10 | META Meta Platforms, Inc. | 2.35% |
|---|
| 11 | AVGO Broadcom, Inc. | 2.13% |
|---|
| 12 | STX Seagate Technology Holdings plc | 1.90% |
|---|
| 13 | WMT Walmart, Inc. | 1.76% |
|---|
| 14 | INTC Intel Corp. | 1.59% |
|---|
| 15 | MRVL Marvell Technology, Inc. | 1.36% |
|---|
| 16 | CSCO Cisco Systems, Inc. | 1.32% |
|---|
| 17 | AMAT Applied Materials, Inc. | 1.30% |
|---|
| 18 | NFLX Netflix, Inc. | 1.20% |
|---|
| 19 | PANW Palo Alto Networks, Inc. | 1.18% |
|---|
| 20 | COST Costco Wholesale Corp. | 1.15% |
|---|
| 21 | — Citigroup Global Markets Holdings, Inc. other | 1.13% |
|---|
| 22 | — Toronto-Dominion Bank (The) other | 1.13% |
|---|
| 23 | — BNP Paribas Issuance BV other | 1.12% |
|---|
| 24 | — Royal Bank of Canada other | 1.12% |
|---|
| 25 | — ASML Holding NV | 1.11% |
|---|
| 26 | — BNP Paribas Issuance BV other | 1.11% |
|---|
| 27 | — Royal Bank of Canada other | 1.11% |
|---|
| 28 | — Toronto-Dominion Bank (The) other | 1.10% |
|---|
| 29 | ADI Analog Devices, Inc. | 1.10% |
|---|
| 30 | — Citigroup Global Markets Holdings, Inc. other | 1.10% |
|---|
| 31 | — Toronto-Dominion Bank (The) other | 1.09% |
|---|
| 32 | — Royal Bank of Canada other | 1.09% |
|---|
| 33 | — Goldman Sachs Bank USA other | 1.09% |
|---|
| 34 | — BNP Paribas Issuance BV other | 1.05% |
|---|
| 35 | — BNP Paribas Issuance BV other | 1.04% |
|---|
| 36 | — Citigroup Global Markets Holdings, Inc. other | 1.01% |
|---|
| 37 | — Citigroup Global Markets Holdings, Inc. other | 1.00% |
|---|
| 38 | — JPMorgan Prime Money Market Fund short-term investment (cash) | 0.89% |
|---|
| 39 | SNDK Sandisk Corp. | 0.86% |
|---|
| 40 | TXN Texas Instruments, Inc. | 0.83% |
|---|
| 41 | PLTR Palantir Technologies, Inc. | 0.78% |
|---|
| 42 | CRWD Crowdstrike Holdings, Inc. | 0.76% |
|---|
| 43 | TER Teradyne, Inc. | 0.73% |
|---|
| 44 | LIN Linde plc | 0.72% |
|---|
| 45 | PEP PepsiCo, Inc. | 0.66% |
|---|
| 46 | BKNG Booking Holdings, Inc. | 0.65% |
|---|
| 47 | — JPMorgan Securities Lending Money Market Fund short-term investment (cash) | 0.62% |
|---|
| 48 | ISRG Intuitive Surgical, Inc. | 0.61% |
|---|
| 49 | CSX CSX Corp. | 0.60% |
|---|
| 50 | VRTX Vertex Pharmaceuticals, Inc. | 0.59% |
|---|
| 51 | QCOM QUALCOMM, Inc. | 0.58% |
|---|
| 52 | NXPI NXP Semiconductors NV | 0.54% |
|---|
| 53 | TMUS T-Mobile US, Inc. | 0.52% |
|---|
| 54 | APP AppLovin Corp. | 0.51% |
|---|
| 55 | MNST Monster Beverage Corp. | 0.50% |
|---|
| 56 | WDC Western Digital Corp. | 0.49% |
|---|
| 57 | SNPS Synopsys, Inc. | 0.49% |
|---|
| 58 | MAR Marriott International, Inc. | 0.45% |
|---|
| 59 | ORLY O'Reilly Automotive, Inc. | 0.45% |
|---|
| 60 | MDLZ Mondelez International, Inc. | 0.42% |
|---|
| 61 | — Space Exploration Technologies Corp. | 0.41% |
|---|
| 62 | ABBV AbbVie, Inc. | 0.40% |
|---|
| 63 | CMCSA Comcast Corp. | 0.39% |
|---|
| 64 | REGN Regeneron Pharmaceuticals, Inc. | 0.38% |
|---|
| 65 | SHOP Shopify, Inc. | 0.37% |
|---|
| 66 | ARM ARM Holdings plc | 0.36% |
|---|
| 67 | MELI MercadoLibre, Inc. | 0.36% |
|---|
| 68 | AMGN Amgen, Inc. | 0.34% |
|---|
| 69 | ETN Eaton Corp. plc | 0.34% |
|---|
| 70 | INTU Intuit, Inc. | 0.34% |
|---|
| 71 | HON Honeywell International, Inc. | 0.32% |
|---|
| 72 | — Honeywell Aerospace, Inc. | 0.31% |
|---|
| 73 | NBIS Nebius Group NV | 0.30% |
|---|
| 74 | XEL Xcel Energy, Inc. | 0.28% |
|---|
| 75 | SBUX Starbucks Corp. | 0.27% |
|---|
| 76 | TTWO Take-Two Interactive Software, Inc. | 0.27% |
|---|
| 77 | DE Deere & Co. | 0.27% |
|---|
| 78 | SO Southern Co. (The) | 0.26% |
|---|
| 79 | NEE NextEra Energy, Inc. | 0.26% |
|---|
| 80 | FANG Diamondback Energy, Inc. | 0.26% |
|---|
| 81 | ADBE Adobe, Inc. | 0.24% |
|---|
| 82 | LOW Lowe's Cos., Inc. | 0.23% |
|---|
| 83 | KLAC KLA Corp. | 0.22% |
|---|
| 84 | DASH DoorDash, Inc. | 0.21% |
|---|
| 85 | MA Mastercard, Inc. | 0.21% |
|---|
| 86 | ALNY Alnylam Pharmaceuticals, Inc. | 0.21% |
|---|
| 87 | ROST Ross Stores, Inc. | 0.21% |
|---|
| 88 | BMY Bristol-Myers Squibb Co. | 0.19% |
|---|
| 89 | CPRT Copart, Inc. | 0.19% |
|---|
| 90 | ORCL Oracle Corp. | 0.19% |
|---|
| 91 | KO Coca-Cola Co. (The) | 0.18% |
|---|
| 92 | PLD Prologis, Inc. | 0.16% |
|---|
| 93 | UNH UnitedHealth Group, Inc. | 0.15% |
|---|
| 94 | TMO Thermo Fisher Scientific, Inc. | 0.15% |
|---|
| 95 | CMG Chipotle Mexican Grill, Inc. | 0.15% |
|---|
| 96 | CPAY Corpay, Inc. | 0.15% |
|---|
| 97 | DXCM Dexcom, Inc. | 0.15% |
|---|
| 98 | DDOG Datadog, Inc. | 0.13% |
|---|
| 99 | NOW ServiceNow, Inc. | 0.13% |
|---|
| 100 | UBER Uber Technologies, Inc. | 0.13% |
|---|
| 101 | GILD Gilead Sciences, Inc. | 0.10% |
|---|
| 102 | KHC Kraft Heinz Co. (The) | 0.09% |
|---|
| 103 | ALAB Astera Labs, Inc. | 0.08% |
|---|
| 104 | ABNB Airbnb, Inc. | 0.08% |
|---|
| 105 | PYPL PayPal Holdings, Inc. | 0.08% |
|---|
| 106 | UPS United Parcel Service, Inc. | 0.06% |
|---|
| 107 | HUBS HubSpot, Inc. | 0.06% |
|---|
| 108 | PDD PDD Holdings, Inc. | 0.06% |
|---|
| 109 | WDAY Workday, Inc. | 0.06% |
|---|
| 110 | CEG Constellation Energy Corp. | 0.06% |
|---|
| 111 | MSTR Strategy, Inc. | 0.03% |
|---|
Weight: the holding's value as a share of the fund's net assets, as filed. Futures and cash can make the weights add up to a little more or less than 100%. 91 of 111 holdings link to the company's charts; a holding is linked only when its name matches exactly one company in the SEC's list (— = no link). How this list is read.
Other funds
VOO · IVV · VTI · QQQ · SCHD · VUG · VTV · VO · SPYM · VGT · VB · VIG · XLK · IJH · IWF · QQQM · IJR · RSP · ITOT · VYM · VXF · DFAC · IWD · IWM · IVW · VV · SCHX · SMH · VNQ · VBR · SCHG · IWR · VONG · SPYG · XLF · IVE · IWB · QUAL · XLV · SOXX · JEPI · DGRO · XLE · SCHB · VBK · DYNF · CGDV · SPYV
Not investment advice. This page shows what the fund reported to the SEC. Nothing here is a recommendation about any security. Check important figures against the fund's own filing.