Fund holdings /
JPMorgan Equity Premium Income ETF (JEPI) holdings
JPMorgan Equity Premium Income ETF held 129 positions on Jun 30, 2026, with net assets of $44.75B, as reported to the SEC on Form N-PORT (filed Aug 28, 2026). A fund's holdings report becomes public about 60 days after the date it covers, so this is not today's list.
Over time
Net assets from the fund's SEC reports, and its share price with Pro. The charts need JavaScript.
Largest holdings, charted
+ Add filterSort by Weight in the fund ▾High → low
PRO Chart all 111 companies in the fund, sorted and filtered by the screener's figures.
All 129 holdings
| # | Holding | Weight |
|---|
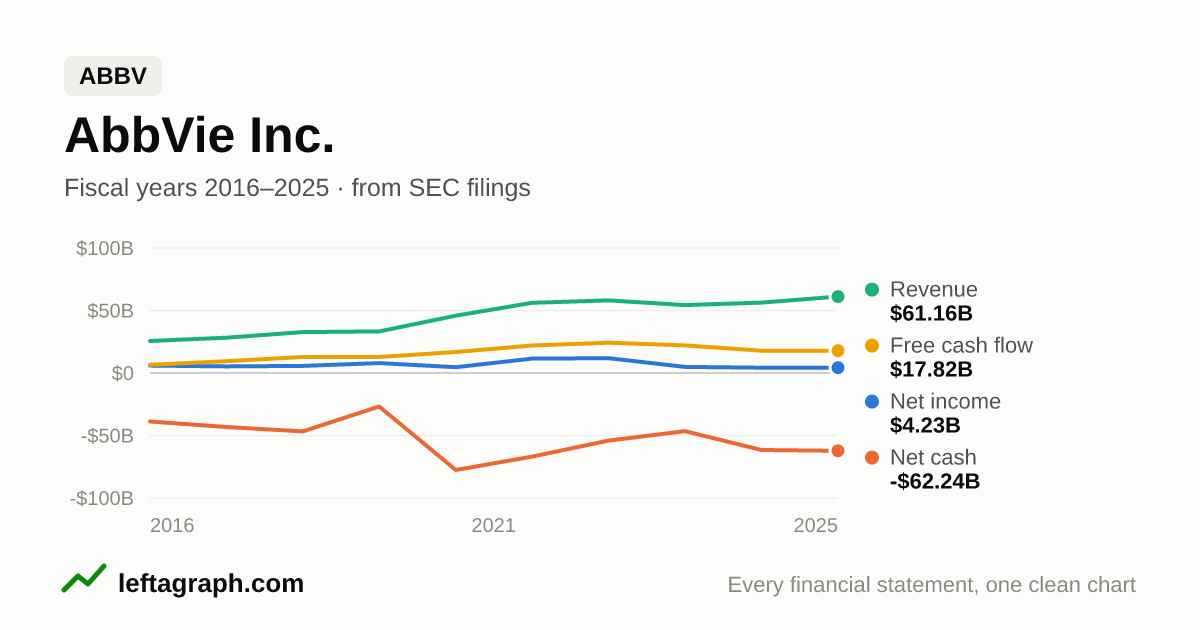
| 1 | ABBV AbbVie, Inc. | 1.72% |
|---|
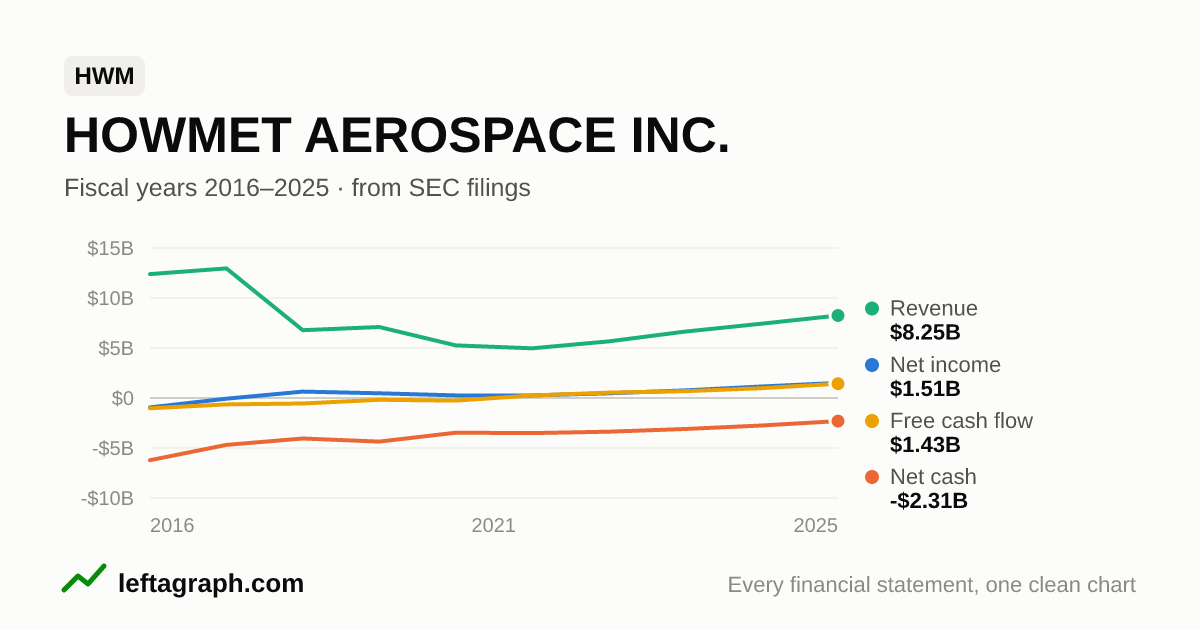
| 2 | HWM Howmet Aerospace, Inc. | 1.68% |
|---|
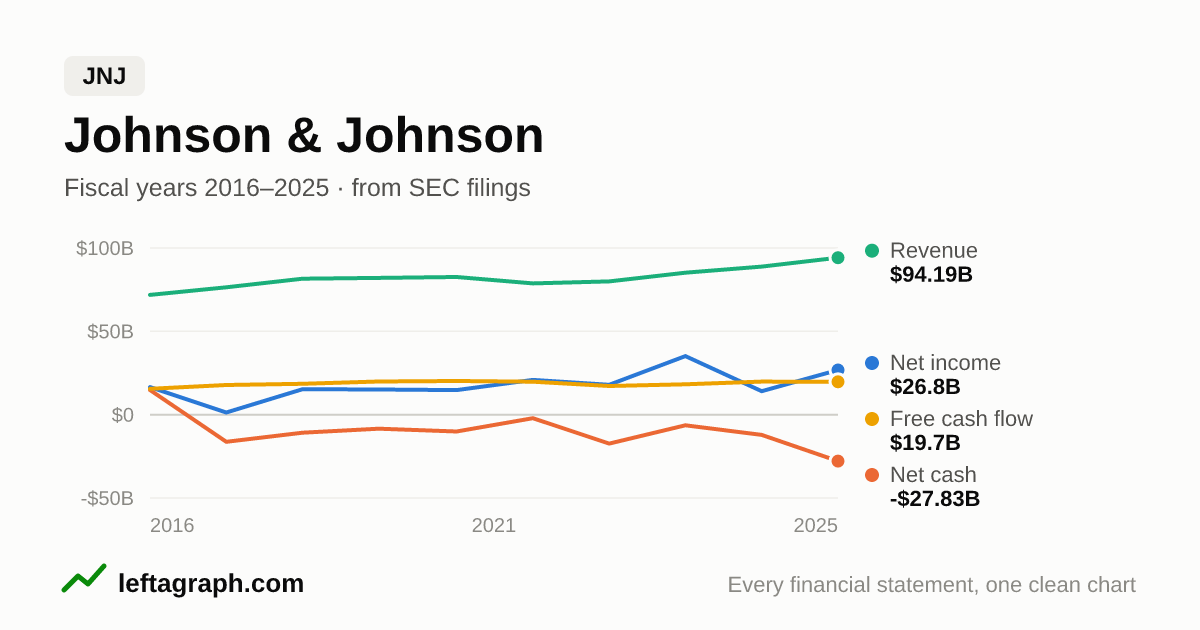
| 3 | JNJ Johnson & Johnson | 1.66% |
|---|
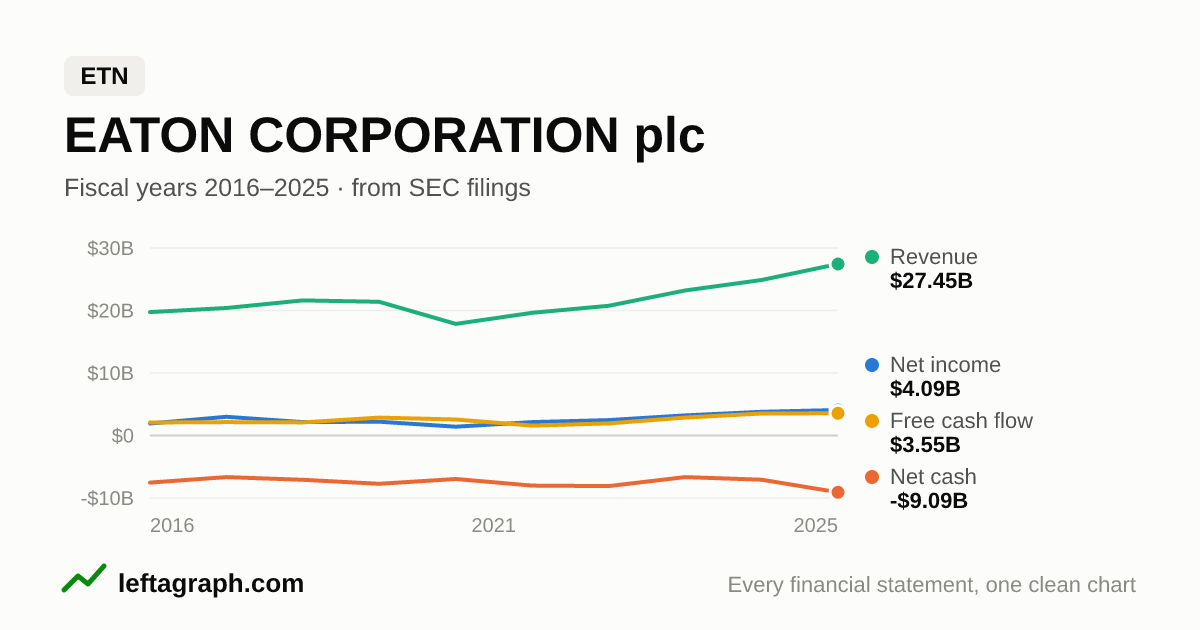
| 4 | ETN Eaton Corp. plc | 1.62% |
|---|
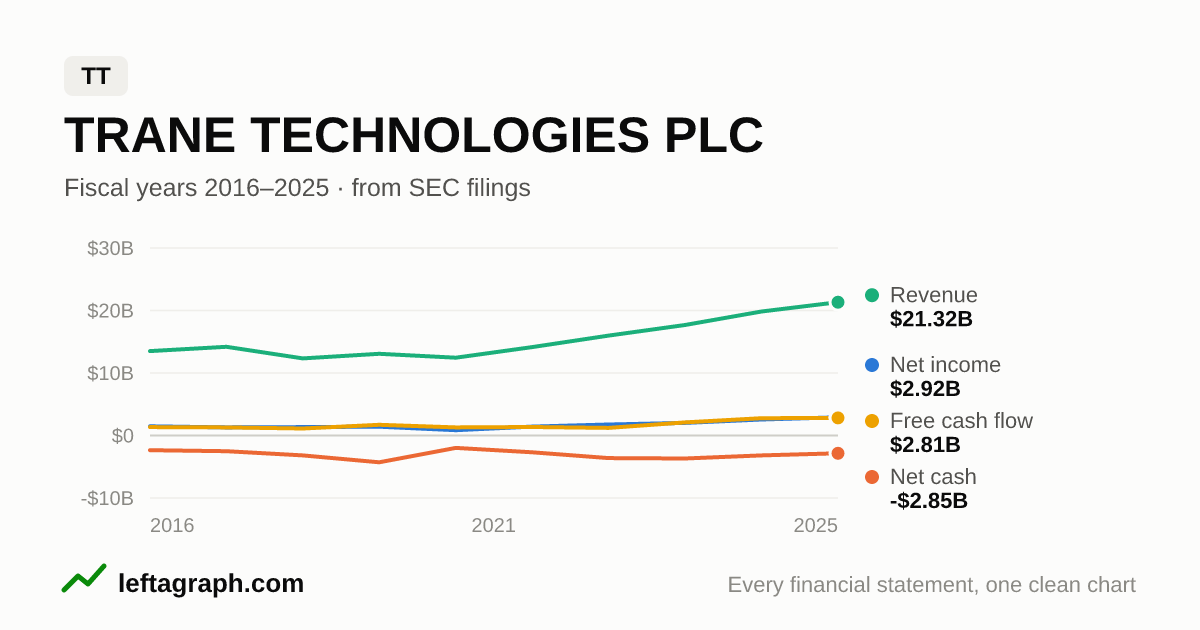
| 5 | TT Trane Technologies plc | 1.60% |
|---|
| 6 | LRCX Lam Research Corp. | 1.56% |
|---|
| 7 | NVDA NVIDIA Corp. | 1.52% |
|---|
| 8 | AAPL Apple, Inc. | 1.52% |
|---|
| 9 | ROST Ross Stores, Inc. | 1.51% |
|---|
| 10 | GOOGL Alphabet, Inc. | 1.50% |
|---|
| 11 | NEE NextEra Energy, Inc. | 1.48% |
|---|
| 12 | VRTX Vertex Pharmaceuticals, Inc. | 1.46% |
|---|
| 13 | AMZN Amazon.com, Inc. | 1.46% |
|---|
| 14 | EOG EOG Resources, Inc. | 1.45% |
|---|
| 15 | MMM 3M Co. | 1.42% |
|---|
| 16 | RTX RTX Corp. | 1.42% |
|---|
| 17 | V Visa, Inc. | 1.41% |
|---|
| 18 | AXP American Express Co. | 1.39% |
|---|
| 19 | YUM Yum! Brands, Inc. | 1.38% |
|---|
| 20 | PM Philip Morris International, Inc. | 1.34% |
|---|
| 21 | LOW Lowe's Cos., Inc. | 1.33% |
|---|
| 22 | MA Mastercard, Inc. | 1.33% |
|---|
| 23 | AVGO Broadcom, Inc. | 1.31% |
|---|
| 24 | CDNS Cadence Design Systems, Inc. | 1.29% |
|---|
| 25 | MSFT Microsoft Corp. | 1.28% |
|---|
| 26 | ECL Ecolab, Inc. | 1.27% |
|---|
| 27 | MDLZ Mondelez International, Inc. | 1.23% |
|---|
| 28 | BMY Bristol-Myers Squibb Co. | 1.23% |
|---|
| 29 | DIS Walt Disney Co. (The) | 1.22% |
|---|
| 30 | SYK Stryker Corp. | 1.22% |
|---|
| 31 | MCD McDonald's Corp. | 1.21% |
|---|
| 32 | META Meta Platforms, Inc. | 1.21% |
|---|
| 33 | PEP PepsiCo, Inc. | 1.19% |
|---|
| 34 | EMR Emerson Electric Co. | 1.18% |
|---|
| 35 | COST Costco Wholesale Corp. | 1.11% |
|---|
| 36 | ADI Analog Devices, Inc. | 1.10% |
|---|
| 37 | APH Amphenol Corp. | 1.08% |
|---|
| 38 | ETR Entergy Corp. | 1.07% |
|---|
| 39 | REGN Regeneron Pharmaceuticals, Inc. | 1.05% |
|---|
| 40 | LLY Eli Lilly & Co. | 1.04% |
|---|
| 41 | CMG Chipotle Mexican Grill, Inc. | 1.02% |
|---|
| 42 | SRE Sempra | 0.98% |
|---|
| 43 | EQIX Equinix, Inc. | 0.98% |
|---|
| 44 | — BNP Paribas Issuance BV other | 0.96% |
|---|
| 45 | — BNP Paribas Issuance BV other | 0.95% |
|---|
| 46 | VRT Vertiv Holdings Co. | 0.95% |
|---|
| 47 | — Barclays Bank plc other | 0.94% |
|---|
| 48 | — National Bank of Canada other | 0.94% |
|---|
| 49 | — BNP Paribas Issuance BV other | 0.93% |
|---|
| 50 | — Citigroup Global Markets Holdings, Inc. other | 0.93% |
|---|
| 51 | — BofA Finance LLC other | 0.91% |
|---|
| 52 | — Royal Bank of Canada other | 0.91% |
|---|
| 53 | — National Bank of Canada other | 0.91% |
|---|
| 54 | WMT Walmart, Inc. | 0.91% |
|---|
| 55 | — Barclays Bank plc other | 0.89% |
|---|
| 56 | — Royal Bank of Canada other | 0.88% |
|---|
| 57 | — GS Finance Corp. other | 0.88% |
|---|
| 58 | — Barclays Bank plc other | 0.88% |
|---|
| 59 | — GS Finance Corp. other | 0.88% |
|---|
| 60 | — BNP Paribas Issuance BV other | 0.88% |
|---|
| 61 | AON Aon plc | 0.86% |
|---|
| 62 | SO Southern Co. (The) | 0.82% |
|---|
| 63 | MRK Merck & Co., Inc. | 0.80% |
|---|
| 64 | AJG Arthur J Gallagher & Co. | 0.76% |
|---|
| 65 | VTR Ventas, Inc. | 0.73% |
|---|
| 66 | DE Deere & Co. | 0.73% |
|---|
| 67 | — JPMorgan Prime Money Market Fund short-term investment (cash) | 0.70% |
|---|
| 68 | PGR Progressive Corp. (The) | 0.68% |
|---|
| 69 | NFLX Netflix, Inc. | 0.65% |
|---|
| 70 | CPAY Corpay, Inc. | 0.63% |
|---|
| 71 | DOV Dover Corp. | 0.62% |
|---|
| 72 | WELL Welltower, Inc. | 0.61% |
|---|
| 73 | TXN Texas Instruments, Inc. | 0.60% |
|---|
| 74 | MCK McKesson Corp. | 0.60% |
|---|
| 75 | HLT Hilton Worldwide Holdings, Inc. | 0.59% |
|---|
| 76 | MDT Medtronic plc | 0.58% |
|---|
| 77 | DASH DoorDash, Inc. | 0.57% |
|---|
| 78 | BURL Burlington Stores, Inc. | 0.56% |
|---|
| 79 | ISRG Intuitive Surgical, Inc. | 0.54% |
|---|
| 80 | BRK-B Berkshire Hathaway, Inc. | 0.52% |
|---|
| 81 | NXPI NXP Semiconductors NV | 0.51% |
|---|
| 82 | T AT&T, Inc. | 0.50% |
|---|
| 83 | ADSK Autodesk, Inc. | 0.49% |
|---|
| 84 | AMD Advanced Micro Devices, Inc. | 0.46% |
|---|
| 85 | VMC Vulcan Materials Co. | 0.46% |
|---|
| 86 | BAC Bank of America Corp. | 0.46% |
|---|
| 87 | KDP Keurig Dr Pepper, Inc. | 0.44% |
|---|
| 88 | CHD Church & Dwight Co., Inc. | 0.42% |
|---|
| 89 | UNP Union Pacific Corp. | 0.41% |
|---|
| 90 | PG Procter & Gamble Co. (The) | 0.41% |
|---|
| 91 | UNH UnitedHealth Group, Inc. | 0.40% |
|---|
| 92 | ACN Accenture plc | 0.39% |
|---|
| 93 | COP ConocoPhillips | 0.38% |
|---|
| 94 | DHR Danaher Corp. | 0.38% |
|---|
| 95 | CB Chubb Ltd. | 0.38% |
|---|
| 96 | VZ Verizon Communications, Inc. | 0.36% |
|---|
| 97 | INTU Intuit, Inc. | 0.36% |
|---|
| 98 | TDG TransDigm Group, Inc. | 0.36% |
|---|
| 99 | FDX FedEx Corp. | 0.35% |
|---|
| 100 | CTSH Cognizant Technology Solutions Corp. | 0.34% |
|---|
| 101 | AZO AutoZone, Inc. | 0.33% |
|---|
| 102 | ICE Intercontinental Exchange, Inc. | 0.32% |
|---|
| 103 | ORCL Oracle Corp. | 0.32% |
|---|
| 104 | USB US Bancorp | 0.31% |
|---|
| 105 | GLW Corning, Inc. | 0.30% |
|---|
| 106 | CMS CMS Energy Corp. | 0.29% |
|---|
| 107 | BBY Best Buy Co., Inc. | 0.29% |
|---|
| 108 | — Exxon Mobil Corp. | 0.28% |
|---|
| 109 | AMT American Tower Corp. | 0.27% |
|---|
| 110 | KMB Kimberly-Clark Corp. | 0.24% |
|---|
| 111 | MO Altria Group, Inc. | 0.23% |
|---|
| 112 | FTNT Fortinet, Inc. | 0.22% |
|---|
| 113 | ANET Arista Networks, Inc. | 0.22% |
|---|
| 114 | LDOS Leidos Holdings, Inc. | 0.22% |
|---|
| 115 | CVS CVS Health Corp. | 0.21% |
|---|
| 116 | BKR Baker Hughes Co. | 0.21% |
|---|
| 117 | HPE Hewlett Packard Enterprise Co. | 0.20% |
|---|
| 118 | CMI Cummins, Inc. | 0.20% |
|---|
| 119 | EW Edwards Lifesciences Corp. | 0.20% |
|---|
| 120 | — JPMorgan Securities Lending Money Market Fund short-term investment (cash) | 0.15% |
|---|
| 121 | SBAC SBA Communications Corp. | 0.14% |
|---|
| 122 | AWK American Water Works Co., Inc. | 0.13% |
|---|
| 123 | AFRM Affirm Holdings, Inc. | 0.12% |
|---|
| 124 | COF Capital One Financial Corp. | 0.12% |
|---|
| 125 | MNST Monster Beverage Corp. | 0.11% |
|---|
| 126 | FDXF Fedex Freight Holding Co., Inc. | 0.09% |
|---|
| 127 | CARR Carrier Global Corp. | 0.08% |
|---|
| 128 | IR Ingersoll Rand, Inc. | 0.00% |
|---|
| 129 | BSX Boston Scientific Corp. | 0.00% |
|---|
Weight: the holding's value as a share of the fund's net assets, as filed. Futures and cash can make the weights add up to a little more or less than 100%. 111 of 129 holdings link to the company's charts; a holding is linked only when its name matches exactly one company in the SEC's list (— = no link). How this list is read.
Other funds
VOO · IVV · VTI · QQQ · SCHD · VUG · VTV · VO · SPYM · VGT · VB · VIG · XLK · IJH · IWF · QQQM · IJR · RSP · ITOT · VYM · VXF · DFAC · IWD · IWM · IVW · VV · SCHX · SMH · VNQ · VBR · SCHG · IWR · VONG · SPYG · XLF · IVE · IWB · QUAL · XLV · SOXX · DGRO · XLE · SCHB · JEPQ · VBK · DYNF · CGDV · SPYV
Not investment advice. This page shows what the fund reported to the SEC. Nothing here is a recommendation about any security. Check important figures against the fund's own filing.